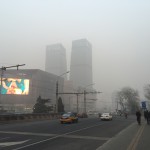
Think pollution in Beijing’s bad? At least you’re not in Yinchuan, where the air quality index is currently at 999.
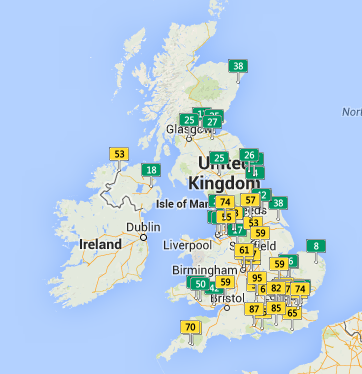
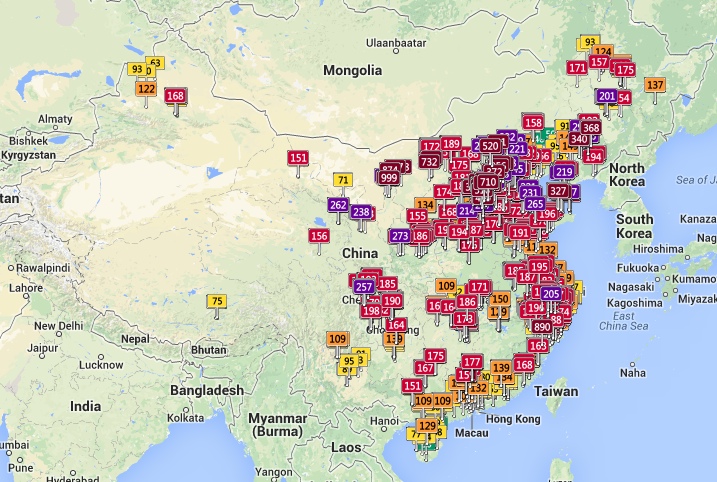
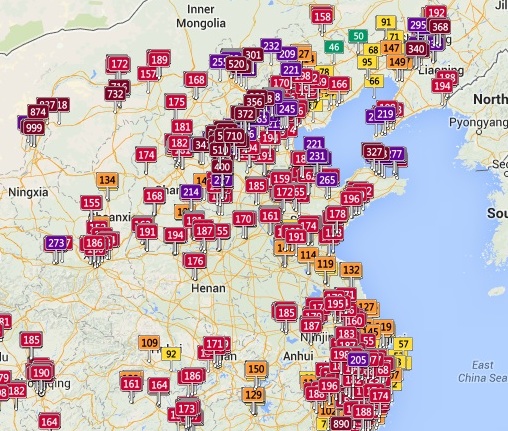
How do we know this? It’s thanks to a brilliant little website called Air Pollution in China (big hat tip to Josh Dyer), which utilizes a “Real-time Air Quality Index Visual Map” that puts Google Map pins on Chinese cities that register AQI readings. The numbers, though sometimes hard to read (there are a lot of overlapping pins), are color-coded to give you a general sense of which areas are blanketed in pollution and which are not. Green is safe and maroon is hazardous.
This website isn’t new — the first post on its FAQ is dated January 11, 2013, and there’s an Android app available for download — but it’s worth mentioning again here. Remember, all data is presented in real-time (to the best of the technology’s ability).
Play around with it. You can also check out the relative pollution levels of cities in other countries…